Status Graph
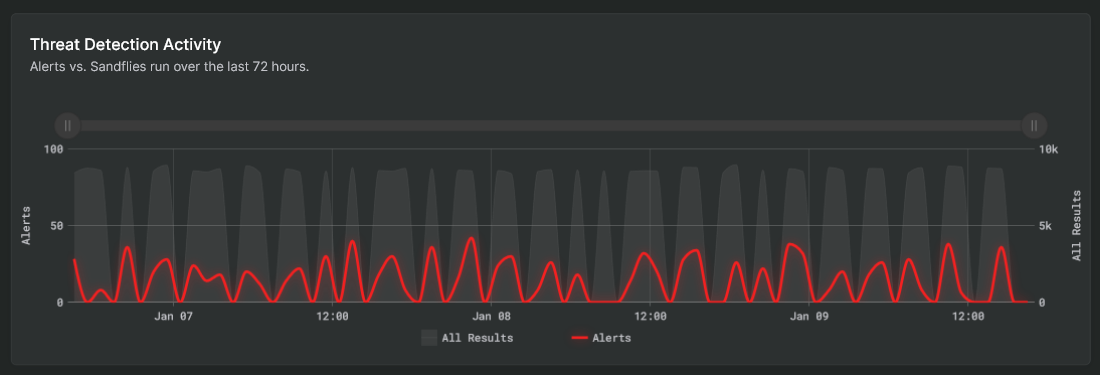
The Threat Detection Activity graph shows information about what Sandfly has done in terms of scans against your systems. The graph shows alerts and passed events (no alarms).
Passed events normally greatly outnumber alerts. As a result they are presented in a logarithmic scale in this chart, where as alerts are displayed at a normal scale.
Numerical values for each hourly period can be seen by hovering your mouse cursor over the graph.

Sandfly Status Graph
INFO: Why is the Status Graph Lumpy?
Sandfly has a unique randomized scheduler to hunt for threats. This random feature not only lowers impact on your hosts, but provides evasion resistance and unpredictability against attackers trying to hide from Sandfly.
As a result of this random schedule, the this graph will appear lumpy as Sandfly shows up and disappears on hosts during and after audits.
Updated 3 months ago
