Viewing Hosts
Once hosts are added to Sandfly, you can see a listing of them on the host view page. Sandfly will show you the first time this host was seen (e.g. when it was added), the last time it was successfully scanned, its hostname, and other details about authentication status, assigned credential, host tags, CPU load, and more.
Below you can see a list of active, inactive, and offline hosts. Active hosts are those that Sandfly was able to successfully authenticate to and inventory. Inactive hosts are those that had a problem authenticating or were unreachable for other reasons. Offline marked hosts were once active, but have not been accessed by Sandfly in the last 24 hours. This offline state could be set for various reasons, so it is good to check as to why. Most typically it is because the host is no longer in any scan schedule, or its schedule(s) may be deactivated or running in cycles greater than 24 hours.
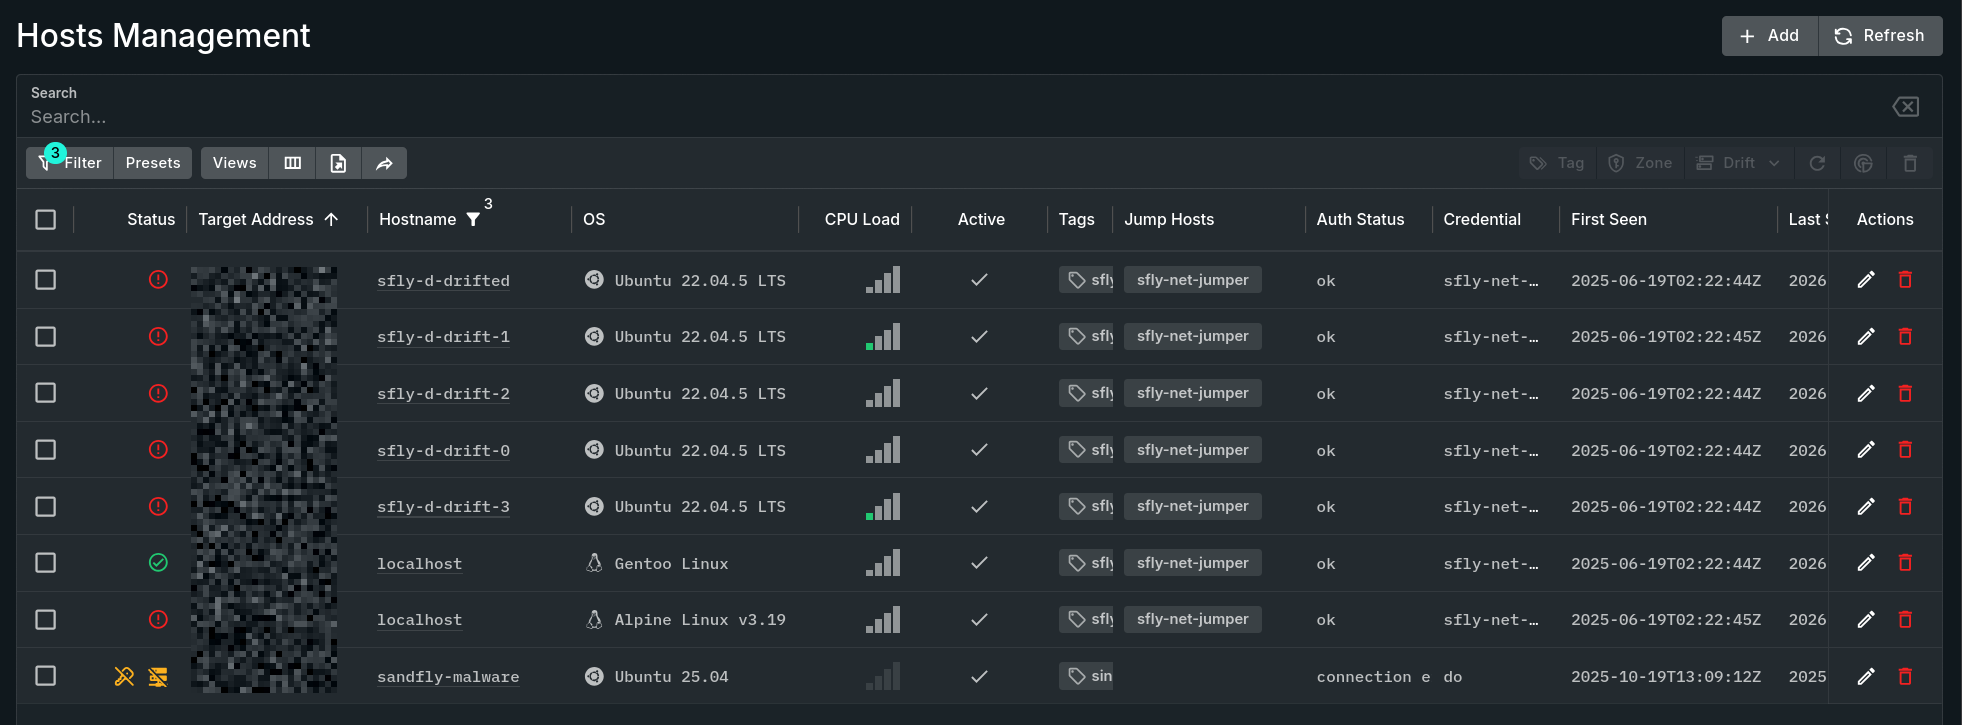
Host Listing
Viewing Host Details
Single clicking on a hyperlinked value or double clicking on a row of data, excluding the checkboxes and the buttons in the Actions column, will open a panel that contains all of the information available for the associated host.
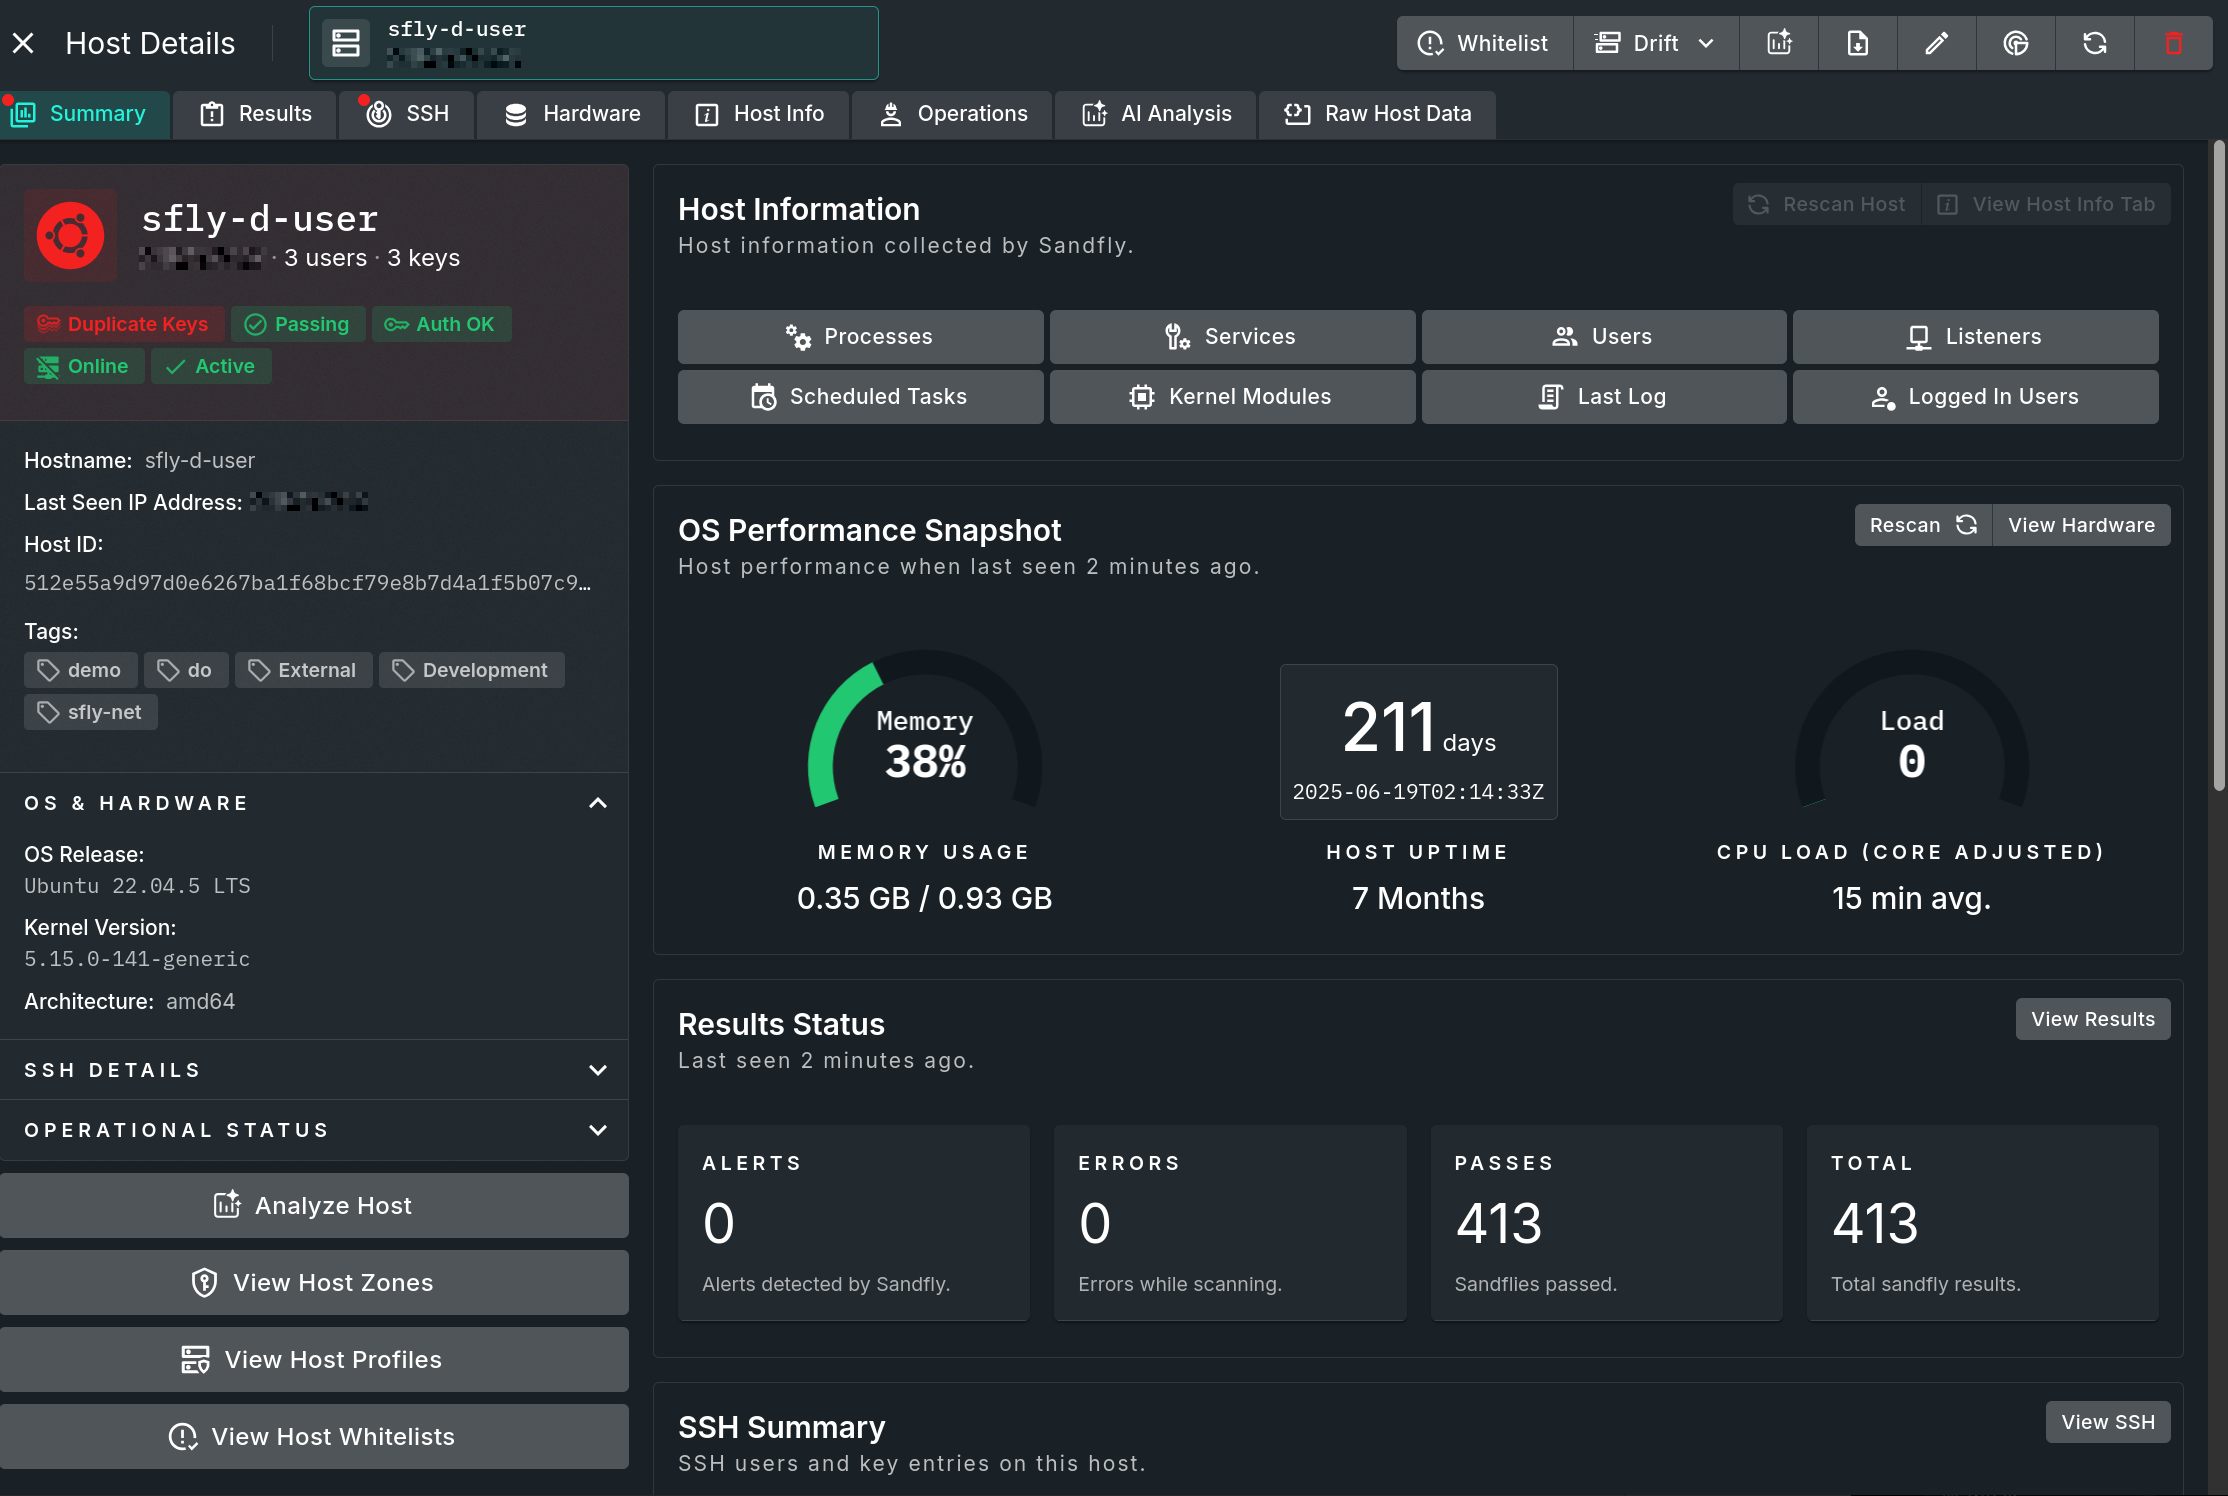
Host Details Panel
Tabs along the top of the pop-out panel divide the selected host's data into the following groupings:
- Summary - A dashboard overview with rolled up information taken from the other tabs.
- Results - Shows the results for this host; the same data as when using the Results By Host option.
- SSH - The host-centric view of its SSH data; the same display as found under Host Investigation.
- Hardware - Displays information on the CPU, memory, DMI info, mounts and network interfaces.
- Host Info - Provides a sub-row of tabs which contain data obtained from various recon sandflies.
- Operations - Provides a sub-row of tabs which contain operational information used by Sandfly.
- AI Analysis - Displays a table which lists all available AI analyses that are associated to the host.
- Raw Host Data - Raw application data for this host provided in the JSON format.
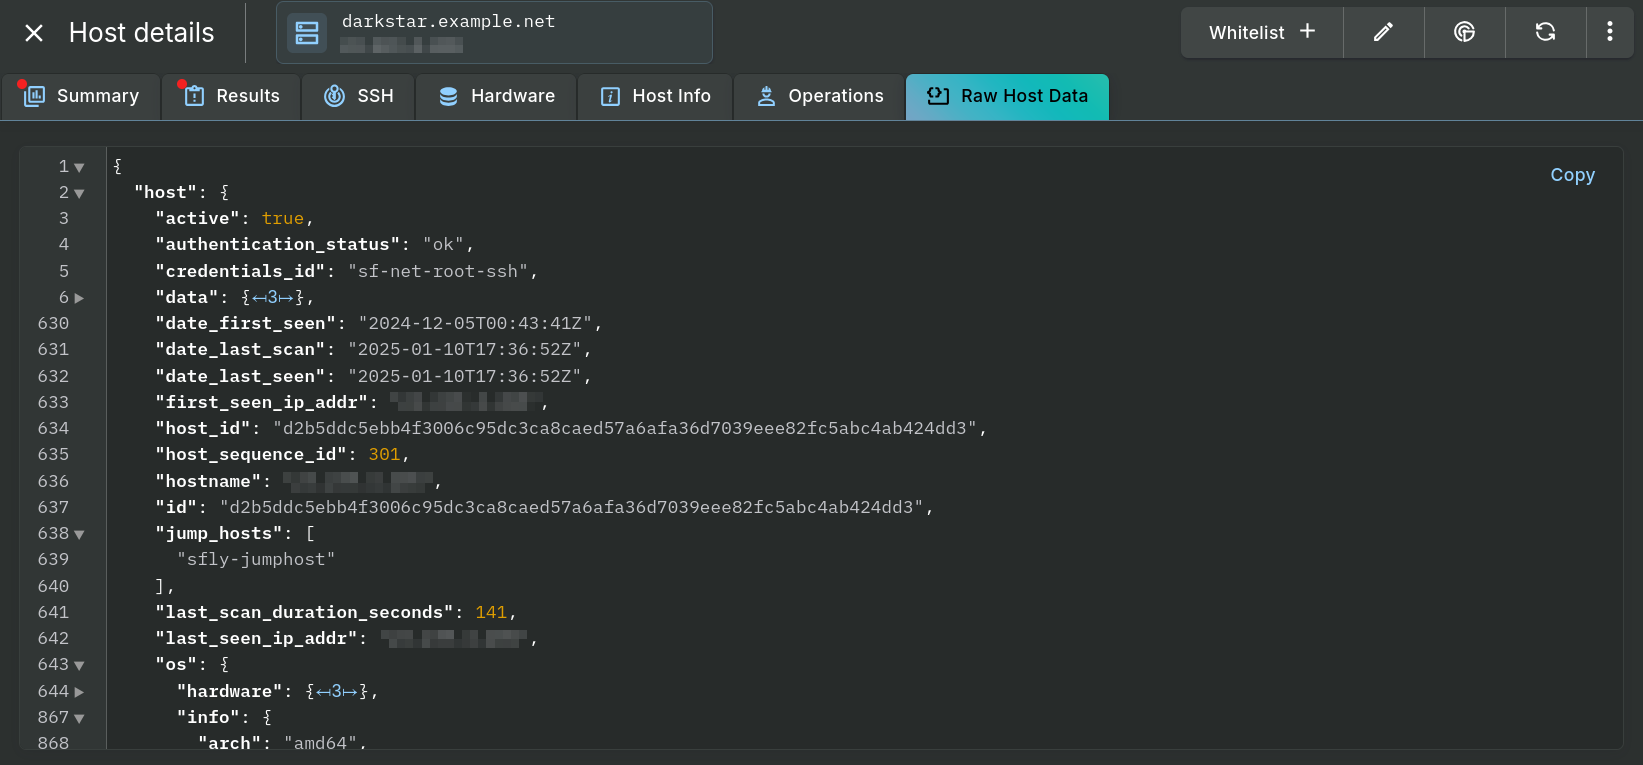
Raw Host Data Tab
A few sections of low-use data is auto-collapsed to focus on the more important elements. A single click on the triangle next to any line number can (un-)collapse the corresponding JSON section. The entire set of data can be quickly copied with a single click on the "Copy" button, which is located in the upper right corner of the tab.
Viewing Inactive Hosts
Hosts that could not be logged into for whatever reason will show up with a yellow, slashed circle icon in the Status column and an "X" in the Active column. The Auth Status column contains information as to why the host is likely in this state.

Inactive Hosts
Host View Toolbar
The data table's toolbar for the host view contains buttons for Filters, filter Presets, custom Views, Column visibility selection, Exportation of data, and Share the current display via a URL. These buttons give you the ability to quickly narrow down your search on large host sets or gain access to additional data.

Host View Top Bar
Filtering
The Filters option allows you to quickly build detailed filters to narrow down the hosts that are displayed in the table. For instance, you could build a filter for hosts with an inactive (false) Auth Status, that start with a Target Address of "10.", and are configured to use a SSH Port of 22 like in the image below. Use other combinations of these and other parameters as needed for displaying data as desired.
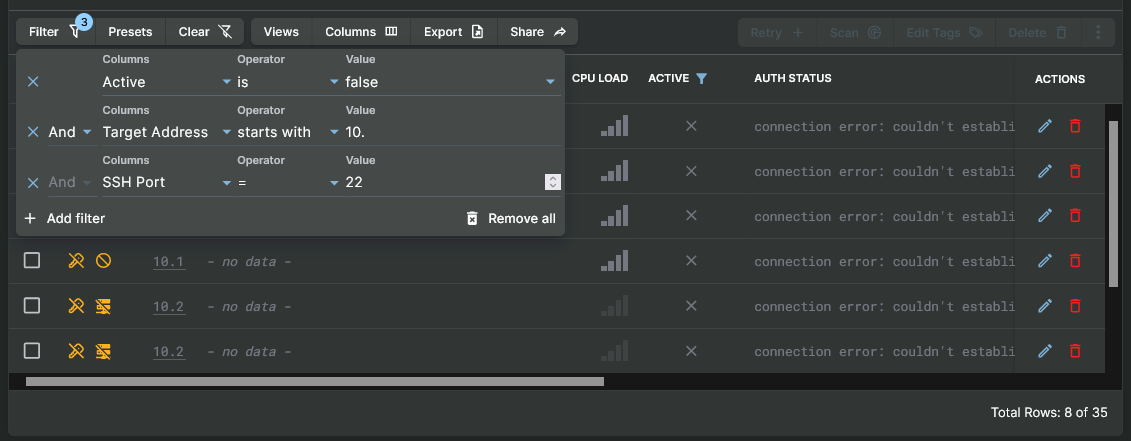
Filtering Down Hosts
Column Selector
The Hosts view has many columns that can be displayed or hidden depending on your preference. Simply toggle which columns that you want to see or not via the toggle boxes.
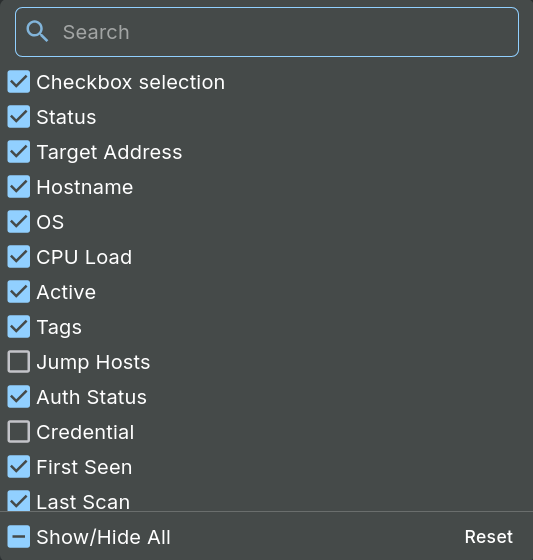
Host Column Selection
Export
You can select hosts and export the columns in the Comma Separated Values (CSV) format with the Export button. Visible column data will be prepared and downloaded via your browser.
Presets
Presets have common options to use with a filter. In the Host view, the presets allow you to quickly see all active hosts or all inactive hosts. This can be used to quickly purge the system of hosts that are not responding.
Deleting Hosts
Hosts that are inactive or you do not want monitored any longer can be deleted.
Below we used the "Inactive Only" filter preset to list all inactive hosts. Then we selected them all by clicking on the checkbox in the header row of the table. The quantity of selected entries is shown for your convenience at the bottom left corner of the table.
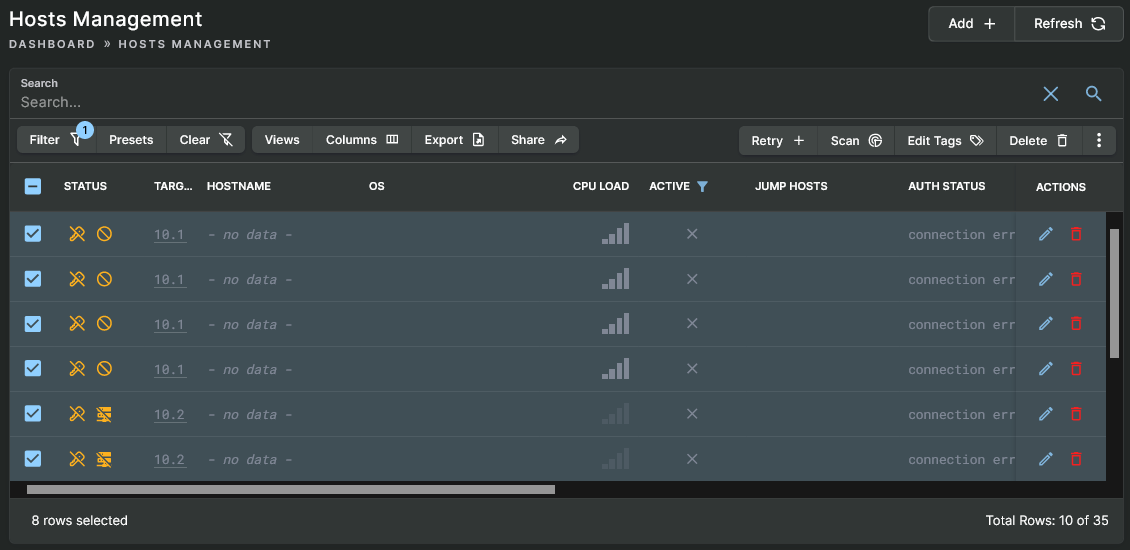
Selecting Inactive Hosts
To delete hosts, simply click on the Delete button in the toolbar. It is important to note that all results data for any removed hosts that were active at some point will be scheduled for deletion in the background.
WARNING: Deleting a Host Also Deletes All of its Results DataAll results data stored in Sandfly will also be removed when a host is deleted. Make a copy of any host data that you may want to store before deleting a host.
Updated 3 months ago