Viewing Sandflies
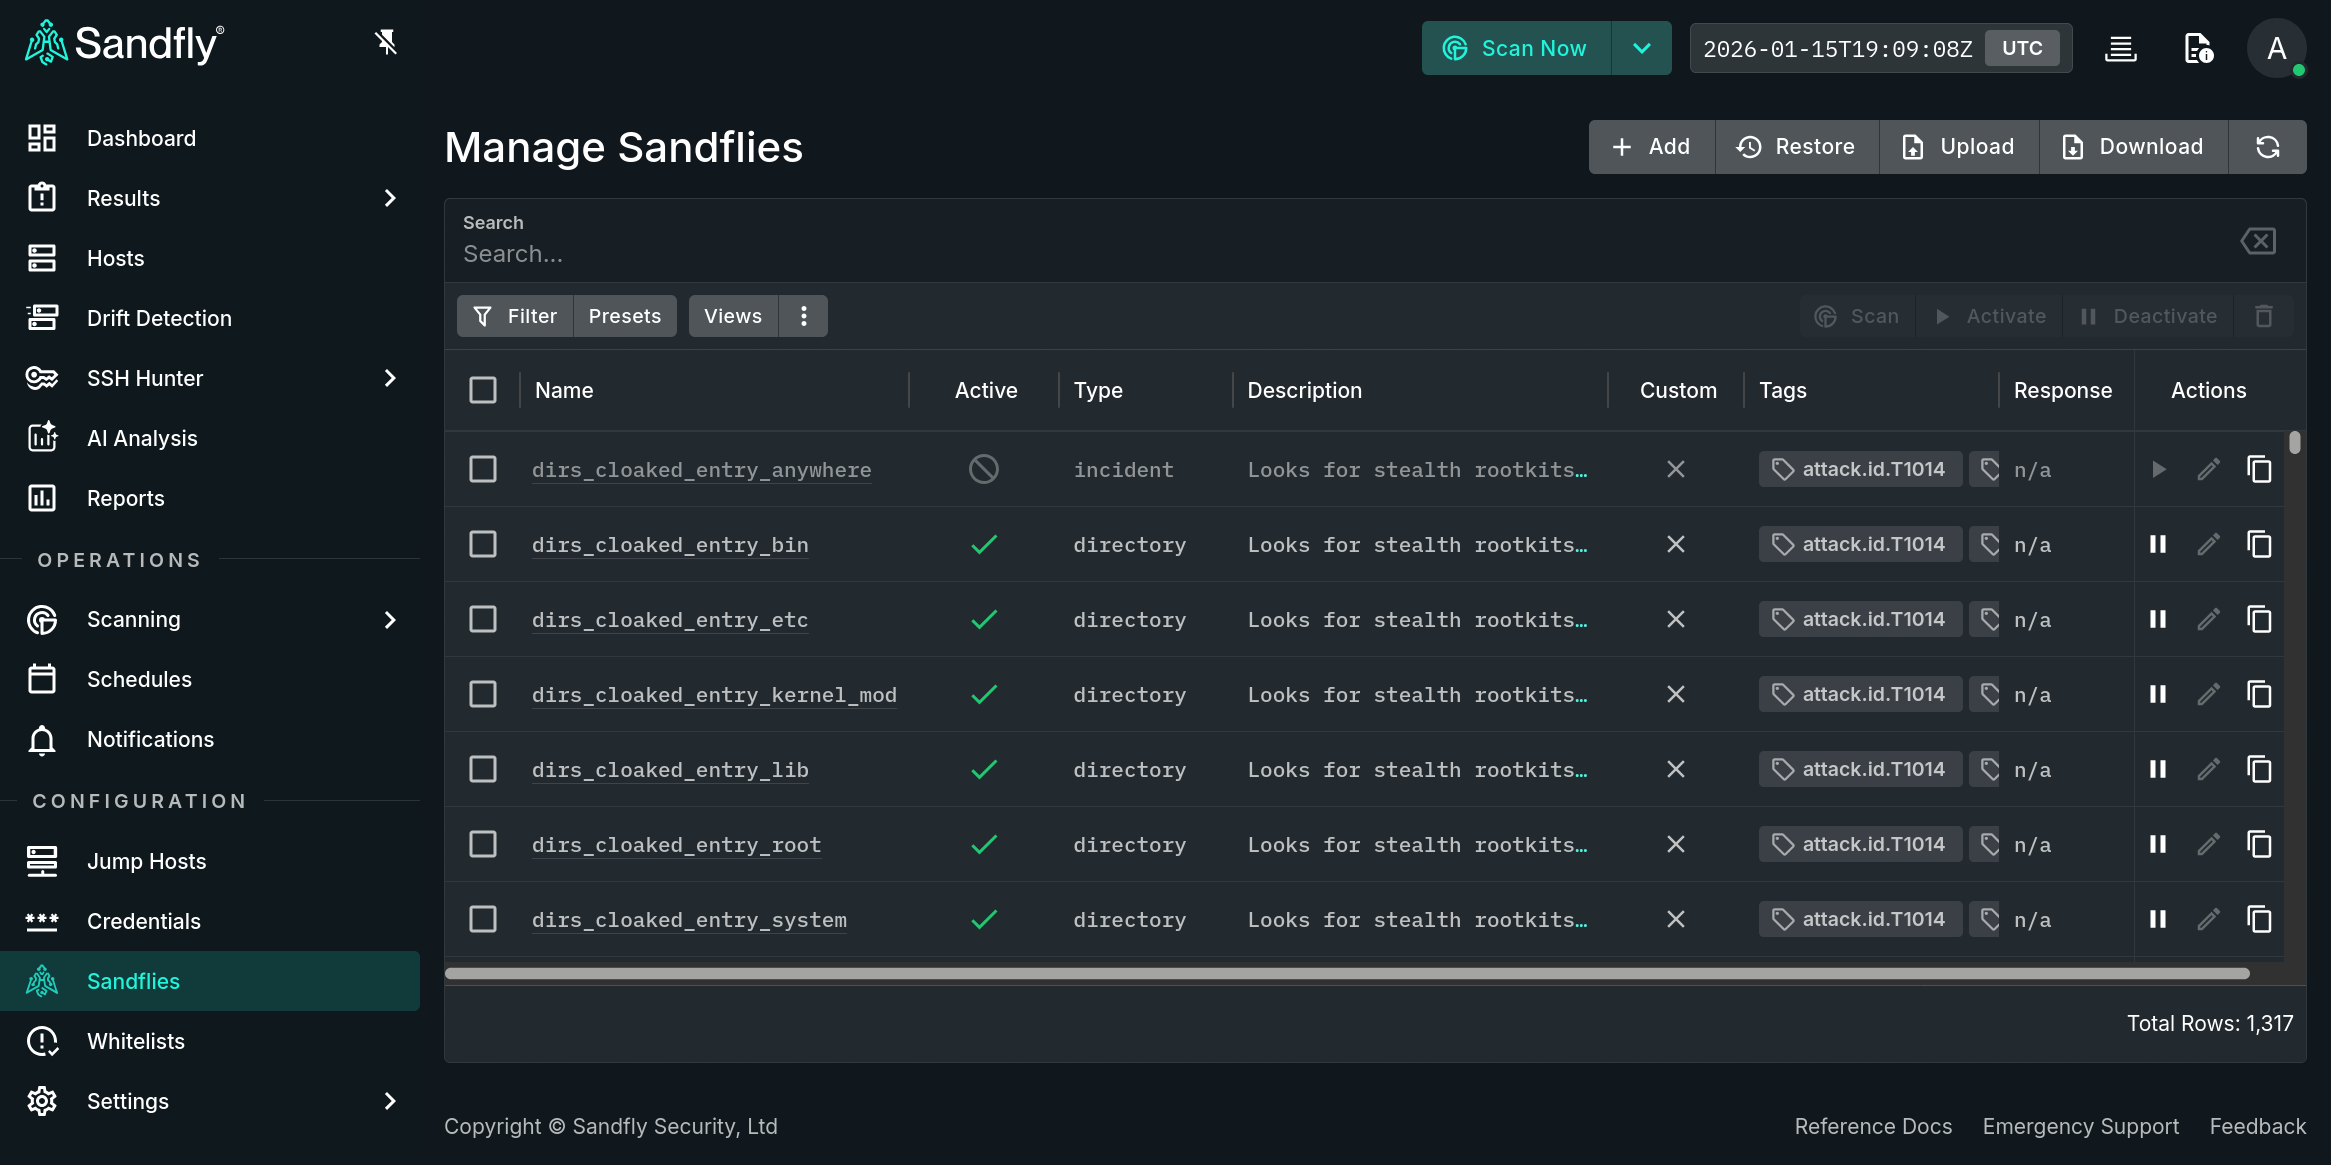
You can view all the sandflies present in the system, along with a short description about what they do and other related data, by clicking on the Sandflies option under the Configuration sub-section.

Sandfly Threat Hunting Modules Listing
The quantity of sandflies that are loaded into the system is shown in bottom right corner of the table. Use the table filters or column sorting to aid in locating desired sandflies. Clicking the hyperlinked name or double clicking on an individual row will open a page with further details about the selected sandfly.
Details about each column:
- Name - Name of the sandfly.
- Active - Shows the state of use. A disabled sandfly will not be included in any scheduled scans, but can be run manually at any time. See the section on Activating and Deactivating Sandflies for more information.
- Type - What category of sandfly it is (file, directory, etc.).
- Description - A short description of what the sandfly does.
- Custom - Shows if it is a custom sandfly or not.
- Tags - Sandfly type or Mitre ATT&CK tags to help categorize the threat type.
- Response - The response action enabled, not enabled or not available for the sandfly.
TIP: Sandfly Timeout ProtectionSandfly has internal timeout mechanisms that will safely stop a sandfly that is taking too long to run. If this happens you will see the error under Scanning > Scanning Error Log as a timeout or watchdog message.
Many sandflies run in under a second, but some of the Incident Response sandflies can take longer to run and could be up to several minutes depending on what they are doing. Incident Response sandflies must be manually selected to run and are never run as part of an automated scan to prevent system impacts.
Updated 4 months ago