Reports
The reports page contains a list of all available reports which provide various views into important data produced by Sandfly. It is accessed by selecting the Reports option in the sidebar.

Reports View
Individual reports that are found on this page offer two display options. The normal view, whose charts and tables can be interacted with in order to explore the data, is accessed by clicking the View button. Alternatively, the print view, which is optimized for printing or saving as a PDF, is accessed by clicking the Print button. The print view page will also automatically open the print dialog window for rapid access to print or save.
Provided Reports
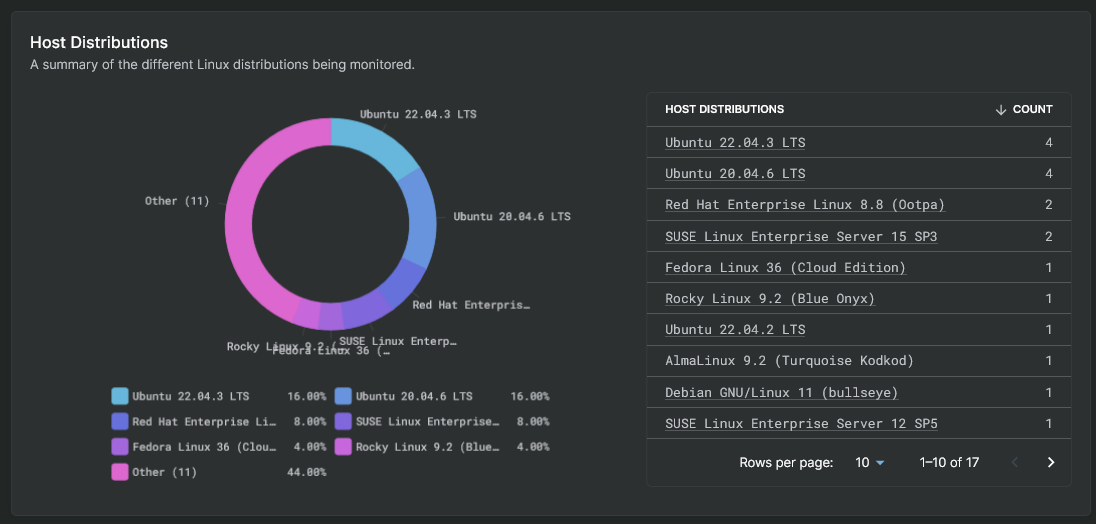
- Host Snapshot - A snapshot of the hosts currently detected and monitored by Sandfly.
- Scan Performance - A summary of scan activity and results over a configurable time frame.
- Preset time ranges include the last 24 hours, 7 days, and 31 days or opt for a custom range.
Line charts found within the reports can zoom in and out or select specific ranges to focus in on target areas of the data. Tag clouds, pie charts, and data tables contain hyperlinked primary data elements that can be clicked on in order to drill down into their associated information.

Data Element Drill Down
TIP: Advanced ReportingFor users who need customized and/or long-term reporting or data correlation with information from other tools, we recommend sending Sandfly results via any supported method into an external, centralized database.
Updated about 1 month ago