
Dashboard
The Dashboard is your first indicator of a threat detected by Sandfly.
Sandfly rates each alert with a severity level, from SEV 0 (context) to SEV 5 (critical). Each level has its own color throughout the User Interface (UI), so the color of an alert, artifact, or host shows how serious it is. The severity of an alert is set by the sandfly that found it. When AI triage is in use, it can reclassify the severity of an artifact based on its verdict. If that reclassification is cleared, the artifact returns to the severity that its sandflies set.
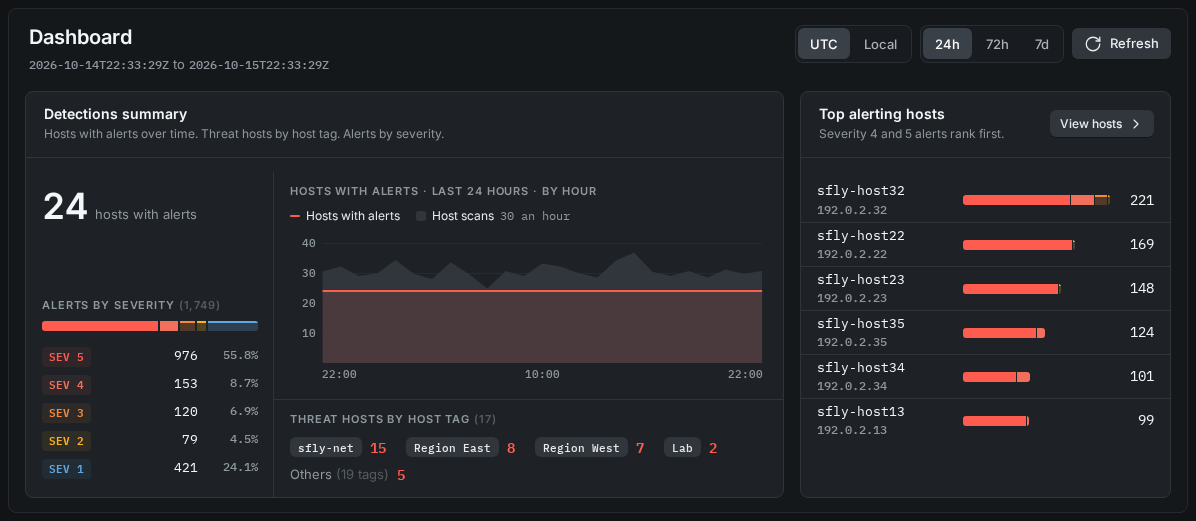
Sandfly Dashboard
At the top, select the period (24h, 72h (default), or 7d) and the time zone (UTC or Local). The data updates automatically every 30 seconds, and you can also refresh it manually.
- Detections summary - Hosts that currently have alerts (with the change over the period), open alerts by severity, a chart of hosts with alerts over the period, and the hosts that AI triage confirmed as threats, by host tag.
- Top alerting hosts - Up to 6 hosts with the most open alerts, SEV 4 and SEV 5 first. Click a host to open its triage view, or click View hosts to open the Host triage list.
- Scan operations - Host scans, scan errors, and artifacts ingested over the period, by hour or by day.
- Scan health - Host and sandfly coverage in the last 24 hours, and the passed, alert, and error results in the period.
- Hosts summary - Total and online hosts, the most common operating systems and versions, and host architectures. Click View report to open the Host snapshot report.
- Zone violations - Up to 5 security zones, with their hosts, keys, users, and ban and key zone violations. Click a zone to open it, or click View zones to open the Security zones list.
- SSH key summary - Active keys, usernames with SSH access, new keys in the period, banned keys in use, and hosts with violations, plus the 4 newest keys. Click View new keys to open the SSH keys list, filtered to the period.
INFO: Why Are the Scan Charts Lumpy?Sandfly has a unique randomized scheduler to hunt for threats. This random feature not only lowers impact on your hosts, but provides evasion resistance and unpredictability against attackers trying to hide from Sandfly.
As a result of this random schedule, these charts will appear lumpy as Sandfly shows up and disappears on hosts during and after audits.
Updated 4 days ago