
Host Triage
The Host triage page lists every host in bands by priority, worst first, with the one finding that matters most about each host and a summary card for the selected host. It is the UI's starting point for triage; for how to work through it, see the Triage Workflow.
To open it, select Host triage in the sidebar, or select Detections > Host triage. The page is the Triage tab of the Hosts page; the All hosts tab next to it is the operational host list described in Viewing Hosts. The Top alerting hosts panel of the Dashboard also opens it with View hosts.
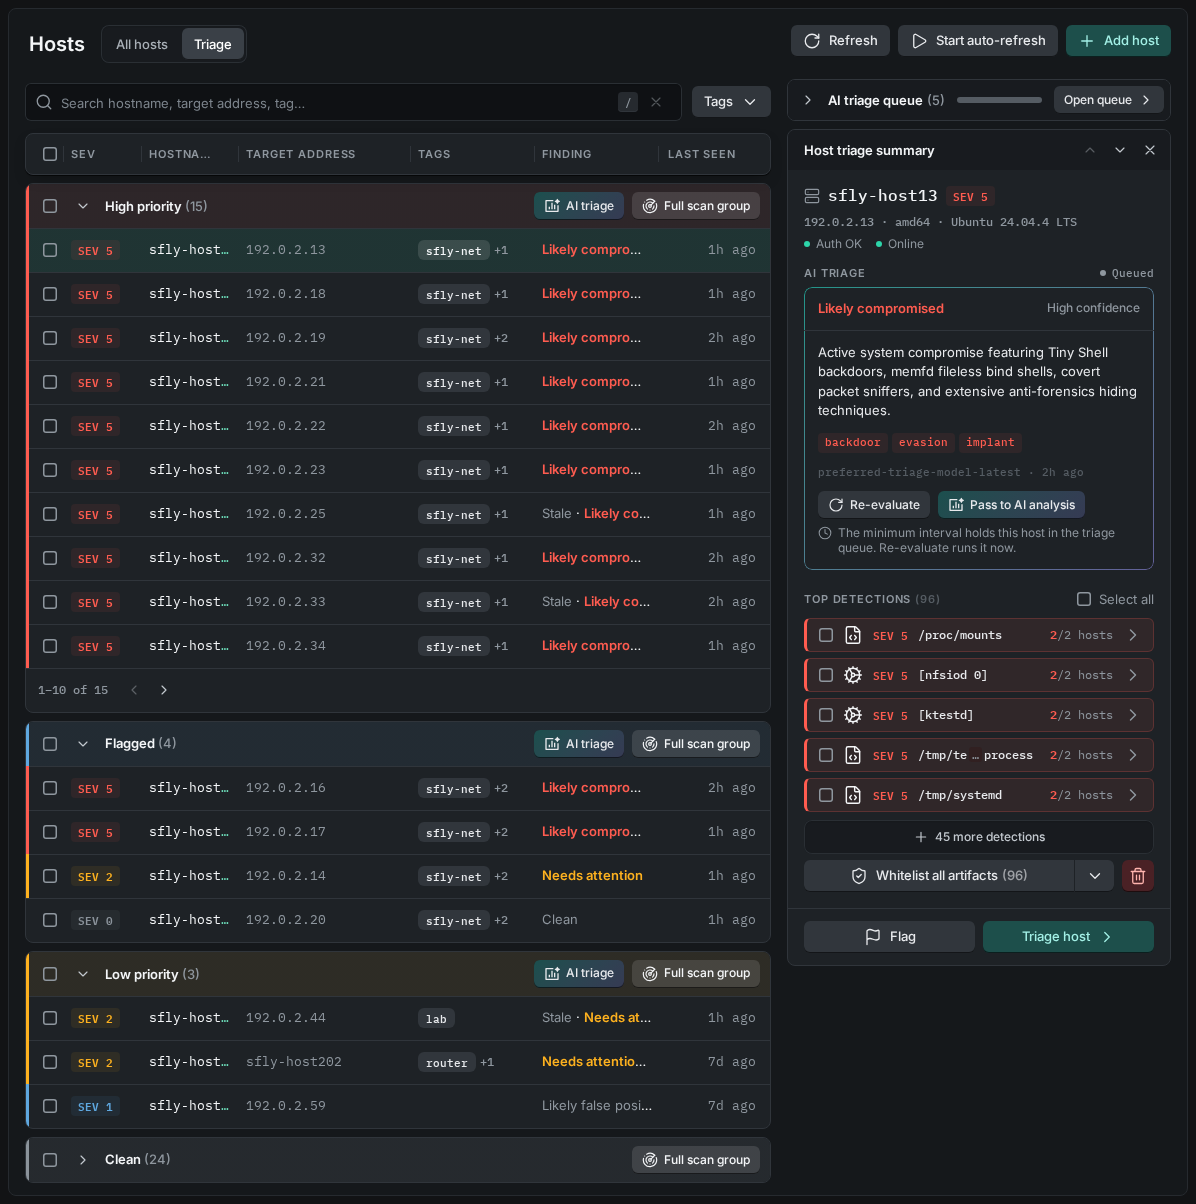
Host Triage Page
Bands
Hosts are grouped into four bands. The band is decided by the host's severity alone, which is the same number that the Sev chip in the row shows.
| Band | Hosts in it |
|---|---|
| High priority | Severity 3 to 5. These hosts have at least one alerting artifact at SEV 3 or above, or an AI triage verdict rated the host there. |
| Flagged | Hosts that a user flagged for attention, whatever their severity. A flag is the host tag flagged. |
| Low priority | Severity 1 to 2. |
| Clean | Severity 0. Nothing is alerting. A host in this band can still have operational problems, such as a scan error or failing SSH authentication, and the Finding column says so. |
Within a band, hosts are sorted by severity, worst first, and then by target address. The header of a scored band takes the color of its worst host. Errors, reachability, and SSH hygiene never move a host between bands; only its severity does.
Columns
| Column | What it shows |
|---|---|
| Sev | The host's severity, SEV 0 to SEV 5. When AI triage has a current verdict for the host, this is the verdict's rating. Otherwise it is the highest severity among the host's alerting artifacts. |
| Hostname | The host's node name. |
| Target address | The address that Sandfly connects to. |
| Tags | The host tags. |
| Finding | The one line to read before anything else. See Reading the Finding column. |
| Last seen | When Sandfly last scanned the host. Hover for the full time. |
Reading the Finding Column
The Finding column leads with the AI triage verdict when the host has one, for example Likely malicious or Likely false positive. When the host's alerts changed after the verdict was formed, the verdict is prefixed with Stale: the words still describe the host as it was, and the host's severity has gone back to its worst alerting artifact until a new verdict lands.
When there is no verdict, the column leads with the triage status when the host is waiting for one, such as Triage queued, Daily limit, or Triage excluded.
After that, the column shows the host's strongest status signal:
- N alerts - The count of alerting artifacts. Not repeated when a current verdict already covers them.
- N zone violations - SSH keys on the host that violate a security zone policy.
- Duplicate SSH keys - A user on the host has more than one copy of the same key.
- N errors - Sandflies that could not complete on the host.
- SSH auth failing - Sandfly can reach the host but cannot log in.
- Never connected - Sandfly has never logged in to this host.
- Not seen recently - The host was active before but has not been scanned recently.
Hover over the finding to read the full sentence behind it.
Host Triage Summary Card
Click a row to focus it. The Host triage summary card on the right fills with that host. When the page opens, the worst host is already focused. Use the up and down arrow keys to move the focus, and the previous and next buttons on the card to step through the visible hosts.
The card shows:
- The host - Its node name and target address, and status dots such as Online, Auth OK, Clean, Scan error, Auth failing, Offline, or Never connected.
- AI triage - The host's AI triage verdict, confidence, brief, and tags, or the state of the request. See AI Triage Block.
- Top detections - The worst alerting artifacts, each with its severity and finding tags. Select the checkboxes to act on some of them. If the host has more detections than the card shows, click the N more detections in Triage link to open the host's Triage tab.
- Flag or Unflag - Set or clear the flag. A flagged host moves to the Flagged band until the flag is cleared.
- Triage host - Open the host's Details page on its Triage tab. On the Summary tab of a host, the same card has View triage instead.
The Top detections section has a whitelist menu with Whitelist all artifacts or Whitelist selected (opens the Whitelist dialog), Whitelist on this host, and Whitelist on all hosts, plus Delete. For the whitelist dialog, see Using the Whitelist Dialog for Artifacts and Hosts.
Under the card, the AI triage queue module shows how many hosts and artifacts are waiting for a verdict. Click Open queue to open the queue on the Task queues page.
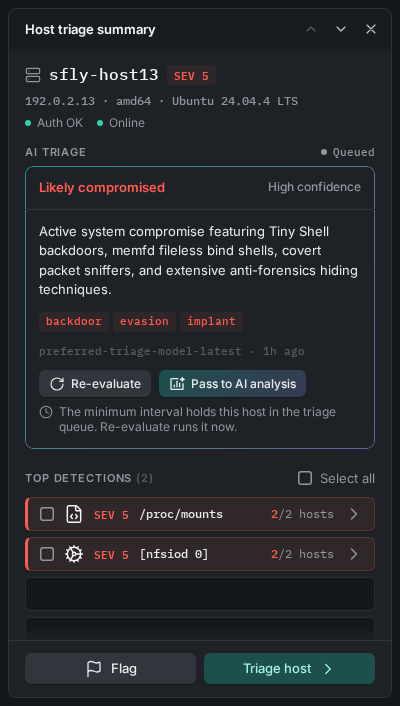
Host Triage Summary Card
AI Triage Block
The AI triage block on the card shows the selected host's AI triage verdict, or the state of the request. Use Run AI triage or Triage now to request a verdict for this host without leaving the page. For every state and button of the block, see AI Triage Block.
Actions
On a Band
Each band header has two actions that apply to every host shown in the band after search and filters:
- Full scan group - Scan every scannable host in the band with all active sandflies immediately. There is no confirmation dialog. Use it to refresh the evidence before a triage pass.
- AI triage - Request an AI triage verdict for every host in the band. Shows only when AI triage is available.
On Selected Hosts
Select hosts with their checkboxes to show the bulk actions:
- Tag - Add or remove host tags.
- Scan - Open the manual scan form with the selected hosts.
- AI triage - Request an AI triage verdict for the selected hosts. A request made by hand goes to the front of the queue and is not held by the daily limit, the minimum interval, or the tag exclusion.
- Whitelist - Whitelist every artifact that is alerting on the selected hosts.
- Flag and Unflag - Set or clear the flag on the selected hosts.
Search and Filters
Use the search field to search by hostname, target address, or tag. Use the Tags quick filter to limit the page to hosts with a tag, for example a business unit or a maintenance window. The bands and their order do not change; a filter only hides rows.
Triage Tab of a Host
The Triage tab of a host's Details page is the same work surface at host level: the host's alerting artifacts, stacked by kind and sorted worst first, with a summary card for the selected detection. To open it, click Triage host on the Host triage summary card, double-click a row on the Host triage page, or click Investigate in the Threats detected notice of the host. For the other tabs of the Details page, see Viewing Hosts.
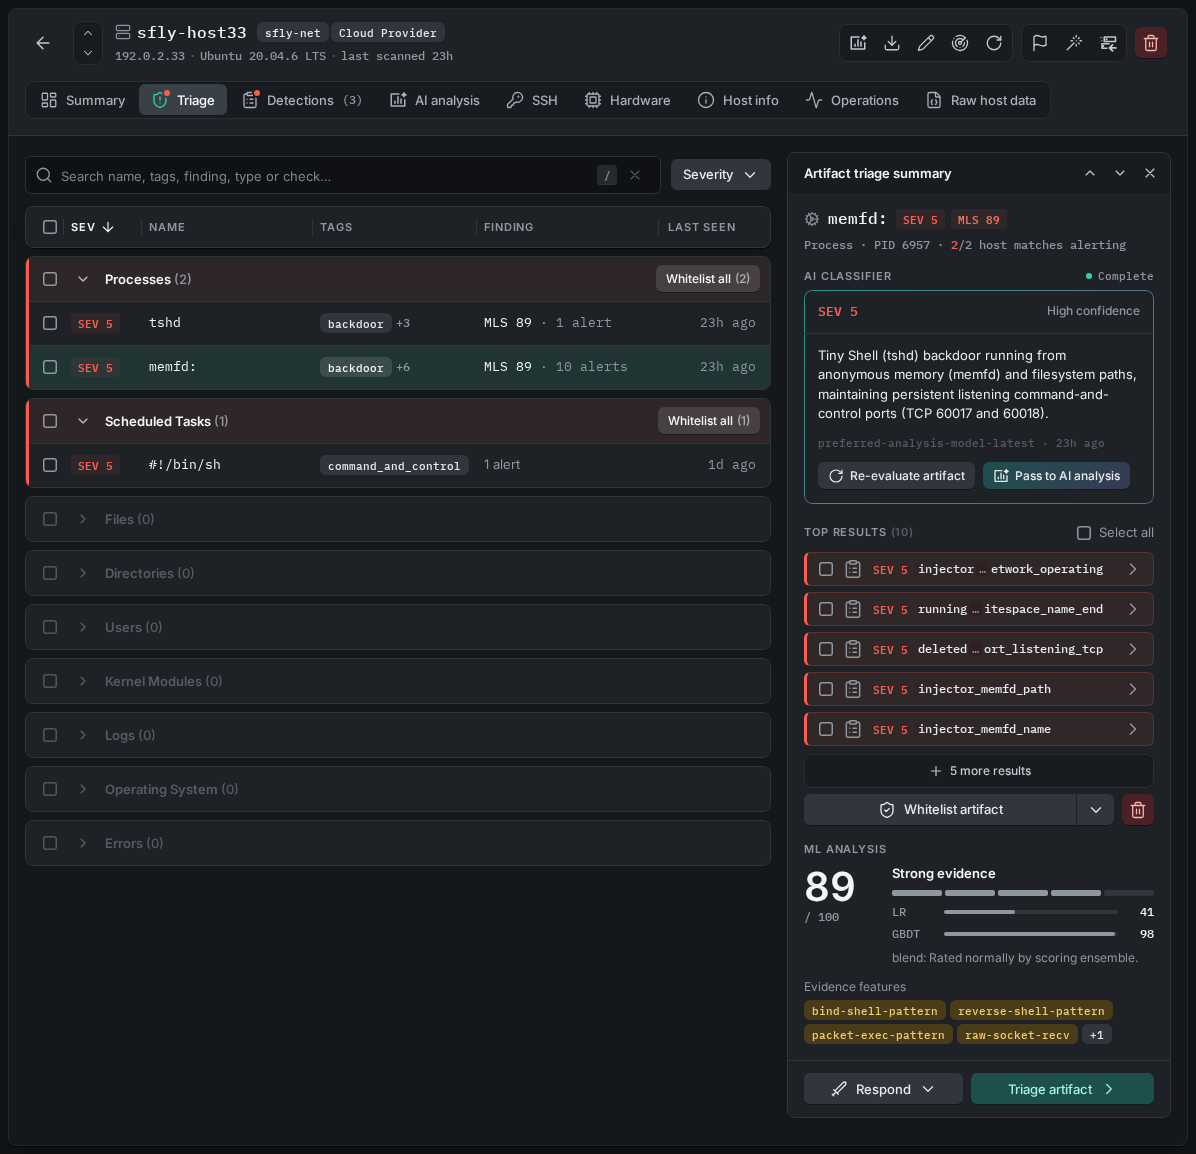
Triage Tab of a Host
Groups
Detections are grouped by what they are, in this order: Processes, Files, Directories, Users, Scheduled Tasks, Kernel Modules, Logs, Operating System, Errors, and Other (only when something lands in it). Groups with detections stack worst first; each group header takes the color of its worst member. An empty group is collapsed and shows a zero, so you can see what was checked and found clean.
Within a group, rows are sorted by severity, worst first. Within one severity, an executable with a higher ML score sorts first, and then the most recently seen artifact.
Columns of the Triage Tab
| Column | What it shows |
|---|---|
| Sev | The artifact's severity, SEV 0 to SEV 5. When an AI triage finding or classification rated the artifact, this is the AI severity. Otherwise it is the highest severity among the sandflies that alerted on it. |
| Name | The artifact's key data: a process name, a file path, a username, a cron entry. Hover for the full value. |
| Tags | The finding tags of the sandflies that matched, for example rootkit, persistence, or suspicious-binary. |
| Finding | The AI classifier's verdict for the artifact when one exists, then the ML score (MLS nn) for an executable, then the number of alerting sandflies (N alerts). |
| Last seen | When the artifact was last seen on the host. |
Use the Severity quick filter to limit the groups to High (4+) or to one level, Level 5 to Level 1. The search field searches the name, the tags, and the finding.
The Artifact Triage Summary Card
Click a row to focus it. The Artifact triage summary card on the right shows the focused detection; the worst one is focused when the tab opens. Use the arrow keys or the card's previous and next buttons to move through the visible rows.
The card shows:
- The artifact - Its severity chip, kind, and name.
- AI classifier - The AI classification of this artifact, or the state of the request. See AI Classifier Block.
- Top results - Each sandfly that is alerting on the artifact, with its severity and the explanation of what it matched. Select the checkboxes to whitelist only some of the sandflies.
- ML analysis - For an executable, the ML score and the Evidence features: what the binary can do, as recovered from its code.
- Whitelist - Whitelist the artifact and clear the contributing alerts.
- Respond - Run a response action against the artifact. Shows for users with the Responder role when a response action applies.
- Triage artifact - Open the artifact's Details page.
Actions on Groups and Selections
- A group header's menu has Whitelist all, which whitelists every detection the group shows after search and filters.
- Select rows with their checkboxes to show the bulk actions: Whitelist (the selected detections), Respond (Retrieve binaries and files, Suspend processes, Resume processes, and Kill processes; each applies only to the selected detections that it fits), Add to profile (adds the selected detections to an existing drift profile), and Delete.
Updated about 2 hours ago